1. Introduction
E-commerce has been present in Vietnam since the early 2000s, but its growth accelerated significantly in the post-Covid-19 period, becoming a crucial part of the national economy nowadays
| [24] | Nguyen Thi Hue & Luu Thi Mai Phuong. (2024). Developing e-commerce in Vietnam, Current Situation and Solutions. International Journal of Advanced Multidisciplinary Research and Studies, 4(2), 1285-1291. |
[24]
. According to the Vietnam E-commerce Association
| [35] | VECOM. (2025). Vietnam E-business Index 2025. Hanoi: Vietnam E-commerce Association. |
[35]
, e-commerce contributes approximately 15% to 20% of the country’s total retail sales. Several major domestic e-commerce platforms, including Shopee, Lazada, and Tiki, have played a significant role in this growth. By implementing regular promotional campaigns—such as date-based discounts (e.g., February 2, March 3, May 5), Flash Sales campaigns, and free shipping incentives—they have attracted millions of visits and transactions within a short period, resulting in a substantial increase in sales volume
| [23] | Nguyen Binh Phuong Duy & Bui Thanh Khoa. (2022). Consumer behavior in Online Flash Sale: Partial least squares structural equation modeling (PLS-SEM) analysis. DASA 2022, (pp. pp 88-93). Chiangrai, Thailand. |
[23]
.
Previous research has widely adopted theoretical frameworks such as the Technology Acceptance Model (TAM), the Technology–Organization–Environment (TOE) framework, and the Diffusion of Innovation (DOI) theory to examine the determinants of online purchasing behavior. TAM emphasizes the influence of perceived usefulness and perceived ease of use on individuals’ acceptance of information systems
| [8] | Davis, F. D. (1989). Perceived Usefulness, Perceived Ease of Use, and User Acceptance of Information Technology. MIS Quarterly Vol. 13, No. 3 (Sep., 1989), 319-340. |
| [27] | Pavlou, P. A. (2003). Consumer Acceptance of Electronic Commerce: Integrating Trust and Risk with the Technology Acceptance Model. International Journal of Electronic Commerce, Vol. 7, No. 3 (Spring, 2003), 101-134. |
[8, 27]
. The TOE framework provides a comprehensive model for understanding the adoption of technological innovations at the organizational level by incorporating technological, organizational, and environmental contexts
| [32] | Tiago Oliveira & Maria F. Martins. (2010). Understanding e-business adoption across industries in European countries. Industrial Management & Data Systems, Vol. 110 No. 9, 1337-1354. |
| [34] | Tornatzky, L. G. & Fleischer, M. (1990). The Processes of Technological Innovation. Lexington: Lexington Books. |
[32, 34]
. DOI theory, on the other hand, explains the adoption of innovations based on attributes such as relative advantage, compatibility, and complexity
| [29] | Rogers, E. M. (2003). Diffusion of Innovations, Fifth edition. New York: Free Press. |
| [42] | Zhou, T., Lu, Y., & Wang, B. (2010). Integrating TTF and UTAUT to explain mobile banking user adoption,. Computers in Human Behavior, 26, 760-767. |
[29, 42]
.
In contrast to these approaches, the present study employs the Task–Technology Fit (TTF) theory to explore consumer behavior in the context of e-commerce platforms. TTF posits that the effective use of technology is contingent upon the degree of alignment between technological functionalities and the tasks that users intend to perform
| [4] | Dale L. Goodhue & Ronald L. Thompson. (1995). Task-Technology Fit and Individual Performance. MIS Quarterly, Vol. 19, No. 2, 213-236. |
[4]
. In e-commerce settings, TTF can be observed in how well a platform facilitates critical activities such as product search, quality evaluation, secure and efficient payment, and order tracking
| [9] | Dishaw, M. T. & Strong, D. M. (1999). Extending the technology acceptance model with task–technology fit constructs. Information & Management 36(1), 9-21. |
| [21] | Lin, C.-P. & Bhattacherjee, A. (2010). Extending technology usage models to interactive hedonic technologies: a theoretical model and empirical test. Information Systems Journal, 20, 163-181. |
[9, 21]
. Recent empirical studies in Vietnam further support this theoretical perspective, suggesting that when consumers perceive a high degree of convenience and task support from an e-commerce system, their likelihood of engaging in online purchasing increases significantly
| [25] | Nguyen Thi Thuy Giang, Hoang Thi Hoai Thuong & Tran Thi Thanh Nhan. (2024). Factors affecting the use of technology for online shopping by consumer in Binh Dinh Province. Quy Nhon Univercity Journal of Science 18(6), 5-18. |
[25]
.
In the context of rapidly evolving digital marketing, Fear of Missing Out (FOMO) has emerged as a significant psychological factor influencing online consumer behavior. FOMO is defined as a pervasive apprehension or anxiety that others might be having rewarding experiences from which one is absent
| [3] | Andrew K. Przybylski, Kou Murayama, Cody R. DeHaan, and Valerie Gladwell. (2013). Motivational, emotional, and behavioral correlates of fear of missing out. Computers in Human Behavior 29(4), 1841-1848. |
[3]
. This phenomenon has become increasingly prevalent in online shopping, particularly as real-time updates, social media interactions, and time-limited promotional offers amplify feelings of urgency and social comparison. Within e-commerce platforms, FOMO is especially evident in flash sales and promotional campaigns that employ psychological triggers such as countdown timers, low-stock alerts, and exclusive limited-time deals. These elements are deliberately designed to evoke a fear of “missing out on an opportunity,” thereby prompting consumers to make quick purchasing decisions with minimal deliberation
| [13] | Hodkinson, C. (2019). Fear of Missing Out’ (FOMO) marketing appeals: A conceptual model. Journal of Marketing Communication 25(1), 65-88. |
[13]
.
From a strategic marketing perspective, FOMO is often deliberately leveraged to shorten the consumer decision-making process and increase conversion rates. Sellers utilize the principles of scarcity and urgency—two core components of FOMO—to influence consumers’ perceptions of value and timing of purchases.
| [16] | Jessica P. Abel, Cheryl L. Buff, and Sarah A. Burr. (2016). Social Media and the Fear of Missing Out: Scale Development and Assessment. Journal of Business & Economics Research, 14(1), 1-12. |
[16]
found that individuals who frequently experience FOMO are more likely to engage in impulsive online shopping, particularly within mobile commerce environments. Furthermore,
| [6] | Dat Ngoc Nguyen & Duy Van Nguyen. (2025). FOMO and the Impulsive Purchasing Behavior of Young People. European Journal of Business and Management Research, 10(3), 41-47. |
[6]
demonstrated that FOMO has a positive effect on the immediate purchase intentions of young consumers in Vietnam, reflecting both cultural and generational factors. Therefore, FOMO should not be viewed merely as an individual emotional state but rather as a strategic mechanism that can be effectively integrated with interactive elements such as flash sales or gamification features in e-commerce platforms. Such integration aims to enhance consumer engagement and stimulate immediate purchasing behavior.
Although both the TTF theory and the concept of FOMO have been explored within the e-commerce domain, there remains a notable gap in the literature regarding the integration of these two perspectives to explain consumer behavior in urgency-driven promotional contexts such as flash sales. TTF emphasizes the functional alignment between technological capabilities and user tasks, positing that users are more likely to adopt and utilize a system when it effectively supports their task-related needs
| [4] | Dale L. Goodhue & Ronald L. Thompson. (1995). Task-Technology Fit and Individual Performance. MIS Quarterly, Vol. 19, No. 2, 213-236. |
| [9] | Dishaw, M. T. & Strong, D. M. (1999). Extending the technology acceptance model with task–technology fit constructs. Information & Management 36(1), 9-21. |
[4, 9]
. In contrast, FOMO introduces a psychological and emotional dimension, capturing the anxiety and urgency individuals feel when they perceive others gaining valuable experiences that they are missing
| [3] | Andrew K. Przybylski, Kou Murayama, Cody R. DeHaan, and Valerie Gladwell. (2013). Motivational, emotional, and behavioral correlates of fear of missing out. Computers in Human Behavior 29(4), 1841-1848. |
| [13] | Hodkinson, C. (2019). Fear of Missing Out’ (FOMO) marketing appeals: A conceptual model. Journal of Marketing Communication 25(1), 65-88. |
[3, 13]
. This emotional trigger often compels immediate action, particularly in time-sensitive online shopping environments.
Integrating TTF and FOMO offers a more comprehensive framework for understanding consumer behavior by accounting for both cognitive evaluations of technology and affective drivers of impulse. This study adopts a dual-theoretical approach, combining TTF and FOMO to examine the factors influencing online purchase intentions during flash sales on e-commerce platforms in Vietnam. By doing so, it contributes theoretically through the synthesis of two distinct conceptual models and provides practical insights for optimizing interface design, marketing strategies, and customer engagement mechanisms in digital retail contexts
| [6] | Dat Ngoc Nguyen & Duy Van Nguyen. (2025). FOMO and the Impulsive Purchasing Behavior of Young People. European Journal of Business and Management Research, 10(3), 41-47. |
[6]
.
The rapid growth of e-commerce in Vietnam has significantly reshaped consumer shopping habits and opened new business opportunities. Vietnam is among the top three fastest-growing e-commerce markets in Southeast Asia, with a projected market size exceeding USD 49 billion by 2025
| [35] | VECOM. (2025). Vietnam E-business Index 2025. Hanoi: Vietnam E-commerce Association. |
[35]
. Major platforms such as Shopee, Tiki, and Lazada have adopted flash sales—short-term, limited-quantity promotions—as a key strategy to drive impulse purchases and increase conversion rates
| [35] | VECOM. (2025). Vietnam E-business Index 2025. Hanoi: Vietnam E-commerce Association. |
[35]
. However, the success of such campaigns depends on the platform’s ability to align technology with user tasks, as proposed by the TTF theory
| [4] | Dale L. Goodhue & Ronald L. Thompson. (1995). Task-Technology Fit and Individual Performance. MIS Quarterly, Vol. 19, No. 2, 213-236. |
[4]
. Consumers are required to complete multiple actions, such as product search, product review, and payment within a limited timeframe. Thus, website design must ensure fast response, clear navigation, and effective promotional integration
| [37] | Wen-Shan Lin & Chun-Hsien Wang. (2012). Antecedences to continued intentions of adopting e-learning system in blended learning instruction: A contingency framework based on models of information system success and task-technology fit. Computers & Education 18(1), 88-99. |
[37]
. This study aims to offer recommendations for enhancing task–technology fit in flash sale campaigns, thereby improving user experience and reducing purchase-related risks.
2. Background Theories
2.1. Task-technology Fit
The Task–Technology Fit (TTF) theory, proposed by Dale L. Goodhue and Ronald L. Thompson, posits that the effectiveness of a technology depends on the degree of alignment between its technical characteristics and the user’s task requirements
| [4] | Dale L. Goodhue & Ronald L. Thompson. (1995). Task-Technology Fit and Individual Performance. MIS Quarterly, Vol. 19, No. 2, 213-236. |
[4]
. Technology is considered valuable only when it enables users to perform tasks more efficiently. In the e-commerce domain,
| [33] | Ting-Peng Liang & Jin-Shiang Huang. (1998). An empirical study on consumer acceptance of products in electronic markets: a transaction cost model. Decision support systems 24(1), 29-43. |
[33]
were among the first to apply TTF, demonstrating that task–technology alignment enhances consumer shopping effectiveness.
| [9] | Dishaw, M. T. & Strong, D. M. (1999). Extending the technology acceptance model with task–technology fit constructs. Information & Management 36(1), 9-21. |
[9]
later extended the model by integrating it with the Technology Acceptance Model (TAM), showing that TTF serves as a critical mediating factor influencing system usage performance.
Subsequent studies have consistently affirmed the relevance of TTF theory in digital environments. For instance,
| [21] | Lin, C.-P. & Bhattacherjee, A. (2010). Extending technology usage models to interactive hedonic technologies: a theoretical model and empirical test. Information Systems Journal, 20, 163-181. |
[21]
found that the alignment between system features and user tasks positively influences users’ attitudes and behaviors toward interactive entertainment systems.
| [31] | SeJoon Hong, James Y. L. Thong, Kar Yan Tam. (2006). Understanding continued information technology usage behavior: A comparison of three models in the context of mobile internet. Decision support systems 24(3), 1819-1834. |
[31]
reported that task–technology alignment significantly affects continued usage behavior on digital platforms, including e-commerce.
| [18] | Judith Gebauer & Ya Tang. (2008). Applying the Theory of Task-Technology Fit to Mobile Information Systems: The Role of User Mobility. International Journal of Mobile Communications, 6(3), 321-344. |
[18]
demonstrated that TTF directly contributes to mobile service acceptance by enhancing individual performance. Similarly,
| [38] | Yang, K. (2010). Determinants of US consumer mobile shopping services adoption: implications for designing mobile shopping services. Journal of Consumer Marketing 27(3), 262-270. |
[38]
showed that consumers are more likely to continue using mobile platforms when they perceive that technological features align with their routine shopping behavior.
In the e-commerce context,
| [37] | Wen-Shan Lin & Chun-Hsien Wang. (2012). Antecedences to continued intentions of adopting e-learning system in blended learning instruction: A contingency framework based on models of information system success and task-technology fit. Computers & Education 18(1), 88-99. |
[37]
found that the fit between website functionality and consumers’ shopping needs positively influences customer satisfaction and repurchase intention.
| [42] | Zhou, T., Lu, Y., & Wang, B. (2010). Integrating TTF and UTAUT to explain mobile banking user adoption,. Computers in Human Behavior, 26, 760-767. |
[42]
further demonstrated that TTF moderates the relationship between website quality and consumer trust. In Vietnam,
| [12] | Hang, N. P. (2021). The factors influencing consumers' online purchasing behavior: A case study of Vietnam. Journal of Management Information and Decision Sciences 24(6), 1-12. |
[12]
confirmed that factors such as interface quality, system functionality, and customization capabilities strongly affect online shopping behavior through the mechanism of task–technology fit. This alignment not only enhances the user experience but also reinforces purchase intention and repeat buying behavior.
2.2. Fear of Missing Out
FOMO, defined as the fear of missing out on attractive opportunities, is an increasingly common psychological state in digital consumer behavior
| [3] | Andrew K. Przybylski, Kou Murayama, Cody R. DeHaan, and Valerie Gladwell. (2013). Motivational, emotional, and behavioral correlates of fear of missing out. Computers in Human Behavior 29(4), 1841-1848. |
[3]
. It is often triggered by factors such as limited-time offers, restricted product availability, or social signals from online communities
| [13] | Hodkinson, C. (2019). Fear of Missing Out’ (FOMO) marketing appeals: A conceptual model. Journal of Marketing Communication 25(1), 65-88. |
[13]
. In the context of e-commerce, marketing strategies that create perceptions of scarcity and urgency have proven effective in driving impulse buying behavior.
Janarthanan Balakrishnan et. al
found that online content characterized by high levels of social interaction and urgency can become addictive, with FOMO acting as a key motivational driver
| [14] | Janarthanan Balakrishnan & Mark D. Griffiths. (2017). Social media addiction: What is the role of content in YouTube? ournal of Behavioral Addictions, 6(3), 364-377. |
[14]
.
| [41] | Zhao Yuxiang, Zhang Xuanhui, Song Xiaokang. (2017). Fear of Missing Out (FoMO) in Mobile Social Media Context: Review and Prospect. Library and Information Service 61(8), 133-144. |
[41]
also emphasized the role of emotional factors in consumer decision-making, particularly within mobile technology environments. Incorporating FOMO into e-commerce research helps address gaps left by traditional rational-choice models such as TAM and UTAUT, which often overlook affective and impulsive dimensions of consumer behavior.
2.3. An Integrated Model of Task–technology Fit and Fear of Missing Out in E-commerce
Although TTF and FOMO originate from distinct disciplines—information systems and social psychology, respectively—both influence consumer behavior in modern e-commerce environments. Integrating these two concepts enables a dual-perspective analysis of user behavior, combining cognitive aspects (e.g., perceived usefulness and performance) with emotional drivers (e.g., fear of missing out).
In fast-paced digital shopping contexts, FOMO can heighten the urgency of decision-making, while TTF ensures that the technology platform adequately supports such behavior. According to
| [2] | Ali Abdallah Alalwan, Yogesh K. Dwivedi, Nripendra P. Rana. (2017). Factors influencing adoption of mobile banking by Jordanian bank customers: Extending UTAUT2 with trust. International Journal of Information Management 37(3), 99-110. |
[2]
, users are more likely to adopt and use technologies they perceive as secure, convenient, and responsive to their needs. When these technological attributes are reinforced by the emotional trigger of FOMO, purchase behavior may be activated more strongly and rapidly.
The integrated TTF–FOMO framework thus extends the theoretical foundation for understanding online consumer behavior and offers practical implications for e-commerce platform designers seeking to optimize user experience and conversion performance.
2.4. Online Quick Purchase Intention
Online quick purchase intention refers to the consumer’s willingness and readiness to make immediate purchase decisions through e-commerce platforms such as Shopee, Tiki, and Lazada during flash sales campaigns. This behavioral construct is considered a key predictor of actual online purchasing behavior in digital environments
| [27] | Pavlou, P. A. (2003). Consumer Acceptance of Electronic Commerce: Integrating Trust and Risk with the Technology Acceptance Model. International Journal of Electronic Commerce, Vol. 7, No. 3 (Spring, 2003), 101-134. |
[27]
.
Such intention is influenced not only by technological factors—such as perceived ease of use and perceived usefulness
| [8] | Davis, F. D. (1989). Perceived Usefulness, Perceived Ease of Use, and User Acceptance of Information Technology. MIS Quarterly Vol. 13, No. 3 (Sep., 1989), 319-340. |
[8]
but also by psychological and emotional drivers, notably the FOMO, which is frequently triggered in time-limited promotional settings
| [13] | Hodkinson, C. (2019). Fear of Missing Out’ (FOMO) marketing appeals: A conceptual model. Journal of Marketing Communication 25(1), 65-88. |
[13]
. Furthermore, the degree of TTF, defined as the alignment between technological features and users’ task requirements, significantly shapes the user experience and ultimately impacts online purchase decisions
| [4] | Dale L. Goodhue & Ronald L. Thompson. (1995). Task-Technology Fit and Individual Performance. MIS Quarterly, Vol. 19, No. 2, 213-236. |
[4]
.
In the highly competitive landscape of e-commerce, measuring and predicting quick purchase intention provides critical insights for digital marketers and platform designers to refine strategic campaigns and improve conversion rates.
3. Research Hypotheses and Model
3.1. Research Hypotheses
In the e-commerce environment, platform design plays a critical role in supporting consumers to complete their shopping tasks efficiently. According to the TTF theory, when platform functionalities—such as product search engines, review systems, and personalized recommendations—are aligned with consumer needs and shopping behaviors, users perceive greater convenience and utility, which in turn enhances their intention to purchase online
| [9] | Dishaw, M. T. & Strong, D. M. (1999). Extending the technology acceptance model with task–technology fit constructs. Information & Management 36(1), 9-21. |
| [21] | Lin, C.-P. & Bhattacherjee, A. (2010). Extending technology usage models to interactive hedonic technologies: a theoretical model and empirical test. Information Systems Journal, 20, 163-181. |
[9, 21]
.
| [42] | Zhou, T., Lu, Y., & Wang, B. (2010). Integrating TTF and UTAUT to explain mobile banking user adoption,. Computers in Human Behavior, 26, 760-767. |
[42]
further noted that this alignment not only improves user experience but also strengthens consumer trust and motivation.
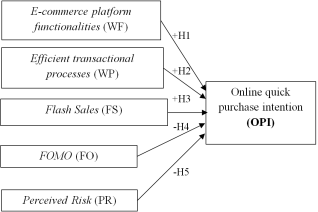
H1: Well-designed e-commerce platform functionalities positively influence consumers’ online purchase intention.
In online shopping environments, transactional processes—such as payment, delivery, return policies, and customer support—are essential in shaping consumer experience. When these processes are clear, fast, and transparent, they enhance consumer satisfaction and confidence, leading to stronger purchase intentions
| [7] | David Gefen, Elena Karahanna and Detmar W. Straub. (2003). Trust and TAM in Online Shopping: An Integrated Model. MIS Quarterly 27(1), 51-90. |
[7]
.
| [27] | Pavlou, P. A. (2003). Consumer Acceptance of Electronic Commerce: Integrating Trust and Risk with the Technology Acceptance Model. International Journal of Electronic Commerce, Vol. 7, No. 3 (Spring, 2003), 101-134. |
[27]
found that effective transaction processes can reduce perceived risk and encourage online buying behavior. Similarly,
| [36] | Viswanath Venkatesh, James Y. L. Thong and Xin Xu. (2012). Consumer Acceptance and Use of Information Technology: Extending the Unified Theory of Acceptance and Use of Technology. MIS Quarterly 36(1), 157-178. |
[36]
emphasized that the completeness and optimization of transactional systems contribute to perceived value and influence consumer decision-making.
H2: Efficient transactional processes on e-commerce platforms positively influence consumers’ online purchase intention.
In the increasingly competitive e-commerce landscape in Vietnam, platforms such as Shopee, Tiki, and Lazada have widely adopted flash sales as a strategic approach to attract consumer attention and stimulate purchasing behavior. The time-bound and quantity-limited nature of flash sales creates a strong sense of urgency and scarcity, which activates the psychological mechanism known as the FOMO, a powerful emotional driver of consumer behavior. Signals such as countdown timers, real-time stock depletion notices, and steep time-limited discounts often lead consumers to make rapid purchase decisions with limited deliberation
| [6] | Dat Ngoc Nguyen & Duy Van Nguyen. (2025). FOMO and the Impulsive Purchasing Behavior of Young People. European Journal of Business and Management Research, 10(3), 41-47. |
[6]
. Prior research has shown that flash sales not only increase conversion rates but also play a critical role in shaping online purchase intentions, particularly among younger consumers who are more responsive to promotional stimuli and digital interaction
| [28] | Reza Salehzadeh & Javad Khazaei Pool. (2017). Brand Attitude and Perceived Value and Purchase Intention toward Global Luxury Brands. Journal of International Consumer Marketing 29(2), 74-82. |
[28]
. In an environment where consumer loyalty is fragile and purchase behavior is highly dynamic, leveraging time and scarcity effectively can serve as a strategic tool to enhance user engagement and drive purchase intentions on e-commerce platforms.
H3: Flash sales campaigns on e-commerce platforms positively influence consumers’ online purchase intention.
FOMO can have both positive and negative effects on online purchase intention, depending on the implementation context and consumer characteristics.
| [3] | Andrew K. Przybylski, Kou Murayama, Cody R. DeHaan, and Valerie Gladwell. (2013). Motivational, emotional, and behavioral correlates of fear of missing out. Computers in Human Behavior 29(4), 1841-1848. |
[3]
describe FOMO as a motivation for individuals to stay constantly connected in fear of missing out on valuable experiences. In the e-commerce context,
| [13] | Hodkinson, C. (2019). Fear of Missing Out’ (FOMO) marketing appeals: A conceptual model. Journal of Marketing Communication 25(1), 65-88. |
[13]
found that FOMO positively influences purchase decisions, particularly when urgency cues (e.g., limited-time offers, remaining stock alerts, and social proof) are clearly communicated. However, excessive exploitation of FOMO may result in negative outcomes, such as consumer stress, post-purchase regret (buyer’s remorse), or feelings of manipulation—ultimately eroding trust in the platform over time
| [19] | Laura Frances Bright & Kelty Logan. (2018). Is my fear of missing out (FOMO) causing fatigue? Advertising, social media fatigue, and the implications for consumers and brands. Internet Research 28(5), 1213-1227. |
[19]
. When urgency is not supported by sufficient information transparency, consumers may perceive the experience as coercive, leading to lower intention to purchase or disengagement from the platform.
H4: FOMO negatively influences consumers’ online purchase intention.
In today’s dynamic e-commerce environment, flash sales have become a widely adopted strategy by platforms such as Shopee, Tiki, and Lazada to stimulate immediate purchases and increase conversion rates. However, along with the accelerated pace of transactions, consumers are often exposed to significant perceived risks in online shopping, including concerns about product quality, information transparency, return policies, and payment security
| [5] | Dan J. Kim, Donald L. Ferrin & H. Raghav Rao. (2008). A trust-based consumer decision-making model in electronic commerce: The role of trust, perceived risk, and their antecedents. Decision support sysstems 44(2), 544-564. |
| [30] | Sandra Forsythe & Bo Shi. (2003). Consumer Patronage and Risk Perceptions in Internet Shopping. Journal of Business Research 56(11), 867-875. |
[5, 30]
. In the context of flash sales, these risks may be intensified due to shortened decision-making time and the urgency created by countdown timers or limited-quantity alerts.
Previous research has identified perceived risk as a critical barrier to online purchase intention
| [7] | David Gefen, Elena Karahanna and Detmar W. Straub. (2003). Trust and TAM in Online Shopping: An Integrated Model. MIS Quarterly 27(1), 51-90. |
| [39] | Yoon, S.-J. (2002). The antecedents and consequences of trust in online-purchase decisions. Journal of Interactive Marketing 16(2), 47-63. |
[7, 39]
. When consumers feel uncertain or lack trust in post-purchase processes, they may delay or avoid purchases—even when promotions are highly attractive. Thus, in time-sensitive sales campaigns like flash sales—where urgency is high but perceived reliability may be questioned—managing perceived risk becomes essential to ensure campaign effectiveness.
H5: Perceived risk in flash sales on e-commerce platforms negatively influences consumers’ online purchase intention.
3.2. Research Model
Figure 1. Proposed research model.
4. Research Methodology
4.1. Data Collection
To test the statistical significance of the hypotheses in the proposed research model, the authors collected data from Vietnamese consumers who had made purchases during Flash Sales programs on three major e-commerce platforms: Tiki, Lazada, and Shopee. The survey comprised demographic questions and a series of Likert-scale items designed to measure the extent to which various factors influence online purchase intention. All 23 questions employed a 5-point Likert scale, ranging from 1 (Strongly Disagree) to 5 (Strongly Agree).
Before sampling, the required sample size was determined to ensure both sample representativeness and suitability for exploratory factor analysis.
According to the guidelines proposed by
| [17] | Joseph F. Hair Jr, William C. Black, Barry J. Babin, Rolph E. Anderson. (2019). Multivariate Data Analysis-Eighth Edition. Hampshire, United Kingdom: Annabel Ainscow. |
[17]
, the minimum sample size should be greater than 5 times the number of observed questions (n) related to influencing factors. Therefore, with 23 observed questions included in the survey, the minimum required sample size is greater than 115. In addition, according to
| [10] | Fidell, Barbara G. Tabachnick & Linda S. (2019). Using Multivariate-seventh edition. Boston: Pearson. |
[10]
, for multiple regression analysis, the minimum required sample size is greater than 50 + 8*m, where m is the number of independent variables. In the proposed research model, where m = 5, so the minimum sample size is 90.
The questionnaire was distributed via social media during the first two weeks of May 2025. A total of 396 valid responses were obtained and considered appropriate for data analysis. This sample size meets the requirements for representativeness and fulfills the assumptions necessary for subsequent statistical analyses. Of the 396 respondents, 58% were female and 42% were male. In terms of age distribution, 20% were over 45 years old, 45% were between 18 and 45 years old, and the remaining 35% were under 18 years old. Regarding purchasing frequency during Flash Sales, 72% of respondents had made more than three purchases, while 28% had purchased between one and three times. All participants stay in Hanoi. The questionnaire for investigating online purchase intention in Flash Sales programs was adopted from previous studies (see
Table 1).
Table 1. Survey questions.
Factors | Questions | Reference |
E-commerce platform functionalities (WF) | The product search function on the e-commerce platform allows me to locate items quickly and efficiently (WF1) | 9, 37, 42] |
The personalized product recommendations provided by e-commerce platforms are relevant to my shopping preferences (WF2) |
The features provided by the e-commerce platform have significantly facilitated my online shopping experience. (WF3) |
The website’s real-time updates (e.g., countdown timers, stock indicators) increase my intention to buy quickly (WF4). |
Sales process of e-commerce platform (WP) | The purchasing process on this e-commerce platform is transparent and user-friendly (WP1) | | [7] | David Gefen, Elena Karahanna and Detmar W. Straub. (2003). Trust and TAM in Online Shopping: An Integrated Model. MIS Quarterly 27(1), 51-90. | | [27] | Pavlou, P. A. (2003). Consumer Acceptance of Electronic Commerce: Integrating Trust and Risk with the Technology Acceptance Model. International Journal of Electronic Commerce, Vol. 7, No. 3 (Spring, 2003), 101-134. |
[7, 27, |
I feel that the steps from ordering to payment are optimized to save time (WP2) |
I am satisfied with the transparency and efficiency of the sales process on this platform (WP3) |
The platform’s efficient sales process increases my intention to make future purchases on it (WP4) |
Flash Sales program (FS) | Flash Sales provide benefits to me when shopping online, such as cost savings and timely purchase opportunities (FS1). | | [26] | P. K. Kannan & Hongshuang “Alice” Li. (2017). Digital marketing: A framework, review and research agenda. International Journal of Research in Marketing, 34, 22-45. |
[26] |
I perceive Flash Sales on platforms such as Shopee, Tiki, and Lazada as highly appealing and effective in capturing my attention (FS2). |
I frequently participate in Flash Sales offered on e-commerce platforms (FS3) |
I experience a fear of missing out when I do not make purchases during Flash Sales (FS4). |
FOMO | I feel pressured when I see that other consumers have purchased a promotional item before me (FO1). | | [13] | Hodkinson, C. (2019). Fear of Missing Out’ (FOMO) marketing appeals: A conceptual model. Journal of Marketing Communication 25(1), 65-88. |
[13] |
Limited-time promotions create a sense of urgency that motivates me to make immediate purchase decisions (FO2). |
Notifications indicating limited stock availability prompt me to make faster purchase decisions (FO3). |
Perceived Risk (PR) | I am concerned that products purchased during Flash Sales may not match their descriptions on the e-commerce platform (PR1). | | [5] | Dan J. Kim, Donald L. Ferrin & H. Raghav Rao. (2008). A trust-based consumer decision-making model in electronic commerce: The role of trust, perceived risk, and their antecedents. Decision support sysstems 44(2), 544-564. | | [7] | David Gefen, Elena Karahanna and Detmar W. Straub. (2003). Trust and TAM in Online Shopping: An Integrated Model. MIS Quarterly 27(1), 51-90. |
[5, 7] |
I am concerned about the lack of assurance regarding the quality of products offered in Flash Sales (PR2). |
I am uncertain about the reliability of the information provided about products and sellers during Flash Sales (PR3). |
I am afraid of potential financial loss or not receiving the product after making a purchase during Flash Sales (PR4) |
Intention to purchase quickly online (OPI) | I intend to shop online through Flash Sales programs because the platform enables me to make purchases easily and efficiently (OPI1). | 13, 31, 37] |
I am willing to make immediate purchase decisions when I see platform features that support quick search and ordering (OPI2). |
I experience a fear of missing out on attractive deals if I do not buy immediately during a Flash Sales program. (OPI3). |
I often decide to purchase quickly when the platform displays remaining stock or limited promotion time (OPI4). |
Source: Authors
4.2. Data Analysis
Reliability Analysis Using Cronbach’s Alpha: The results of the reliability analysis for the constructs in the research model indicate that all five independent variables and the dependent variable exhibit high internal consistency. The Cronbach’s Alpha coefficients range from 0.701 to 0.883, exceeding the commonly accepted threshold of 0.70, thereby confirming the reliability of the measurement scales. The item-total correlation coefficients for all observed variables exceeded the acceptable threshold of 0.30, with the lowest being for variable PR3 (0.540) and the highest for variable FS1 (0.810), except for variable FS4, which had a coefficient below 0.30. These results indicate that the research constructs, as measured by the observed variables, demonstrated good internal consistency and measurement reliability. Following the reliability analysis, 22 observed variables were retained for subsequent analysis (see
Table 2).
Table 2. Results of Construct Reliability Testing in the Research Model.
Iterm | Corrected Item-Total Correlation | Cronbach's Alpha if Item Deleted |
Iterm PR: Cronbach's Alpha = 0,701, N of iterms = 4 |
PR1 | 0.573 | 0.657 |
PR2 | 0.643 | 0.654 |
PR3 | 0.540 | 0.582 |
PR4 | 0.611 | 0.710 |
Iterm FOMO: Cronbach's Alpha = 0, 729, N of iterms= 3 |
FOMO1 | 0.567 | 0.655 |
FOMO2 | 0.565 | 0.634 |
FOMO3 | 0.590 | 0.648 |
Iterm WF: Cronbach's Alpha = 0, 740, N of iterms = 4 |
WF1 | 0.646 | 0.698 |
WF2 | 0.671 | 0.700 |
WF3 | 0.690 | 0.704 |
WF4 | 0.702 | 0.738 |
Iterm FS: Cronbach's Alpha = 0, 883, N of iterms = 3 |
FS1 | 0.810 | 0.855 |
FS2 | 0.787 | 0.841 |
FS3 | 0.754 | 0.820 |
Iterm OPI: Cronbach's Alpha = 0, 781, N of iterms = 4 |
OPI1 | 0.740 | 0.755 |
OPI2 | 0.687 | 0.741 |
OPI3 | 0.654 | 0.720 |
OPI4 | 0.636 | 0.675 |
Iterm WP: Cronbach's Alpha = 0, 817, N of iterms = 4 |
WP1 | 0.665 | 0.734 |
WP2 | 0.690 | 0.748 |
WP3 | 0.741 | 0.762 |
WP4 | 0.752 | 0.776 |
Source: By Authors
Exploratory Factor Analysis (EFA): An Exploratory Factor Analysis (EFA) was performed on 22 observed variables that had met the reliability threshold established by Cronbach’s Alpha testing. To evaluate the appropriateness of factor analysis, several diagnostic measures were applied, including the Kaiser-Meyer-Olkin (KMO) measure of sampling adequacy, inter-item correlation assessment, total variance explained, and factor extraction tests. A KMO value of 0.5 or higher (0.5 ≤ KMO ≤ 1) is considered acceptable, indicating that the data are suitable for factor analysis. Conversely, a KMO value below 0.5 suggests that the sample may not be appropriate for this method. Bartlett’s Test of Sphericity is employed to assess whether the observed variables within a factor are sufficiently correlated to justify the use of Exploratory Factor Analysis (EFA). A necessary condition for conducting EFA is that the observed variables, which represent different dimensions of the same underlying construct, must exhibit significant correlations. Bartlett’s Test is considered statistically significant when the associated p-value (sig.) is less than 0.05, indicating that the correlation matrix is not an identity matrix and that factor analysis is appropriate. In addition, the Eigenvalue criterion is commonly used to determine the number of factors to retain in EFA. According to this criterion, only factors with an Eigenvalue greater than 1.0 are considered meaningful and are retained in the factor solution.
As shown in
Table 3, the KMO value is 0.766, indicating an acceptable level of sampling adequacy for factor analysis. Furthermore, the significance value of Bartlett’s Test is less than 0.05, confirming that the 18 observed variables representing the five independent constructs are sufficiently correlated to justify the use of Exploratory Factor Analysis.
Table 3. KMO and Bartlett's Test.
Kaiser-Meyer-Olkin Measure of Sampling Adequacy. | .766 |
Bartlett's Test of Sphericity | Approx. Chi-Square | 1759.411 |
Df | 120 |
Sig. | .000 |
Similar to the EFA analysis of the dependent variable, the KMO value is 0.867, and the significance value of Bartlett’s Test is less than 0.05, confirming that the observed variables are sufficiently correlated to proceed with Exploratory Factor Analysis (EFA). In
Table 4,
Total Variance Explained shows that one factor was extracted with an eigenvalue of 2.245 (greater than the threshold of 1.0), accounting for 72.339% of the total variance among the three observed variables included in the analysis.
Table 4. Total Variance Explained.
Component | Initial Eigenvalues | Extraction Sums of Squared Loadings |
Total | % of Variance | Cumulative% | Total | % of Variance | Cumulative% |
1 | 2.245 | 76.137 | 76.137 | 2.245 | 76.137 | 76.137 |
Extraction Method: Principal Component Analysis. |
Test of Extracted Variance for 18 Independent Variables: As shown in
Table 5, the cumulative variance value in row 5, column Cumulative%, is 68.590%, which exceeds the commonly accepted threshold of 50%, indicating that the extracted factors explain a substantial proportion of the total variance. Furthermore, the Eigenvalues of the first five factor groups are all greater than 1.0, satisfying the criteria for factor retention in Exploratory Factor Analysis.
Table 5. Total Variance Explained.
Component | Initial Eigenvalues | Extraction Sums of Squared Loadings | Rotation Sums of Squared Loadings |
Total | % of Variance | Cumulative% | Total | % of Variance | Cumulative% | Total | % of Variance | Cumulative% |
1 | 4.553 | 28.458 | 28.458 | 4.553 | 28.458 | 28.458 | 2.980 | 18.627 | 18.627 |
2 | 1.968 | 12.301 | 40.759 | 1.968 | 12.301 | 40.759 | 2.396 | 14.973 | 33.600 |
3 | 1.748 | 10.923 | 51.682 | 1.748 | 10.923 | 51.682 | 1.929 | 12.056 | 45.656 |
4 | 1.473 | 9.208 | 60.891 | 1.473 | 9.208 | 60.891 | 1.908 | 11.925 | 57.582 |
5 | 1.232 | 7.699 | 68.590 | 1.232 | 7.699 | 68.590 | 1.761 | 11.008 | 68.590 |
6 | .803 | 5.018 | 73.608 | | | | | | |
… | | | | | | | | | |
18 | .095 | .595 | 100.000 | | | | | | |
Extraction Method: Principal Component Analysis
Table 6. Rotated Component Matrixa.
| Component |
1 | 2 | 3 | 4 | 5 |
WP1 | .856 | | | | |
WP2 | .835 | | | | |
WP4 | .726 | | | | |
WP3 | .591 | | | | |
FO1 | | .920 | | | |
FO3 | | .890 | | | |
FO2 | | .734 | | | |
FS1 | | | .856 | | |
FS3 | | | .835 | | |
FS2 | | | .819 | | |
WF2 | | | | .798 | |
WF1 | | | | .736 | |
WF4 | | | | .677 | |
WF3 | | | | .659 | |
PR3 | | | | | .804 |
PR2 | | | | | .719 |
PR1 | | | | | .663 |
PR4 | | | | | .575 |
Extraction Method: Principal Component Analysis. Rotation Method: Varimax with Kaiser Normalization. |
a. Rotation converged in 5 iterations. |
Source: By Authors
The results of the rotated component matrix (see
Table 6) display only factor loadings equal to or greater than 0.4. The analysis shows that the 18 observed variables are grouped into five distinct factors. All observed variables have factor loadings exceeding 0.5, indicating strong associations with their respective factors and confirming that no problematic items were identified in the analysis.
4.3. Pearson Correlation Analysis
The purpose of conducting Pearson correlation analysis is to examine the strength of the linear relationship between the dependent variable and the independent variables, as well as to identify potential multicollinearity issues when independent variables are highly correlated with one another. As noted in
| [11] | Field, A. (2018). Discovering Statistics Using IBM SPSS Statistics 5th Edition. Newbury Park: SAGE. |
[11]
, while the Pearson correlation coefficient provides a measure of linear association between two variables, it is important to test whether this correlation is statistically significant. If the significance value (
p < 0.05), the correlation is considered statistically significant, indicating a linear relationship. Conversely, if the significance value is greater than 0.05, there is insufficient evidence to conclude a significant linear association, assuming a 5% significance level (α = 0.05).
The Pearson correlation results are presented in
Table 7. The
Sig. (
2-tailed) values for the correlations between the five independent variables: WF, PR, FO, WP, and FS, and the dependent variable: OPI, are all less than 0.05. This indicates that each independent variable is significantly and linearly correlated with the dependent variable, thereby satisfying the assumption of linear relationships for further regression analysis.
Table 7. Correlations.
| OPI | WF | PR | FO | WP | FS |
OPI | Pearson Correlation | 1 | .102* | -.012 | .091 | .122* | .890** |
Sig. (2-tailed) | | .044 | .011 | .034 | .017 | .000 |
N | 396 | 396 | 396 | 396 | 396 | 396 |
*. Correlation is significant at the 0.05 level (2-tailed). |
**. Correlation is significant at the 0.01 level (2-tailed). |
4.4. Regression Model Analysis
The regression results are presented in
Table 8. The adjusted R-squared value is 0.799, indicating that the five independent variables included in the model collectively explain 79.9% of the variance in the dependent variable OPI.
Table 8. Model Summaryb.
Model | R | R Square | Adjusted R Square | Std. Error of the Estimate | Durbin-Watson |
1 | .895a | .801 | .799 | .2422 | 1.450 |
a. Predictors: (Constant), FS, PR, WF, FOMO, WP |
b. Dependent Variable: OPI |
The ANOVA test yields a significance value (Sig.) of 0.000, which is less than the threshold of 0.05, indicating that the linear regression model is statistically significant and appropriate for explaining the relationship between the variables (see
Table 9).
Table 9. ANOVAa.
Model | Sum of Squares | df | Mean Square | F | Sig. |
1 | Regression | 92.257 | 5 | 18.451 | 314.427 | .000b |
Residual | 22.886 | 390 | .059 | | |
Total | 115.143 | 395 | | | |
a. Dependent Variable: OPI |
b. Predictors: (Constant), FS, PR, WF, FOMO, WP |
To assess the degree of correlation among independent variables in the regression model, the Variance Inflation Factor (VIF) is commonly used. In economic research, a VIF value greater than 1 but less than 2 is generally considered acceptable and indicative of no serious multicollinearity
| [9] | Dishaw, M. T. & Strong, D. M. (1999). Extending the technology acceptance model with task–technology fit constructs. Information & Management 36(1), 9-21. |
[9]
. As shown in
Table 10, all VIF values fall within this acceptable range, suggesting that multicollinearity is not a concern in the regression model.
Table 10. Coefficientsa.
Model | Unstandardized Coefficients | Standardized Coefficients | t | Sig. | Collinearity Statistics |
B | Std. Error | Beta | Tolerance | VIF |
1 | (Constant) | .604 | .125 | | 4.813 | .000 | | |
WF | .072 | .023 | .072 | 3.127 | .002 | .963 | 1.038 |
PR | -.050 | .025 | -.057 | -1.961 | .048 | .603 | 1.657 |
FO | .058 | .020 | .068 | 2.927 | .004 | .932 | 1.073 |
WP | .050 | .020 | .073 | 2.506 | .013 | .608 | 1.645 |
FS | .686 | .018 | .877 | 38.502 | .000 | .983 | 1.018 |
a. Dependent Variable: OPI |
Unstandardized linear regression equation:
OPI = 0.604 + 0.072*WF - 0.050*PR + 0.058*FO + 0.050*WP + 0.686*FS(1)
In Equation (
1), the unstandardized regression coefficients represent the extent of change in the dependent variable when one unit of an independent variable changes, assuming all other independent variables are held constant. Specifically, when Flash Sales (FS) increases by one unit, Online Purchase Intention (OPI) increases by 0.686 units. Conversely, when Perceived Risk (PR) increases by one unit, OPI decreases by 0.050 units, all else being equal.
The standardized linear regression equation is presented as follows:
OPI = 0.072*WF - 0.057*PR + 0.068*FO + 0.073*WP + 0.877*FS(2)
When using the unstandardized regression coefficients in Equation (
1), direct comparison between variables is not possible due to differences in measurement units and standard deviations. Therefore, standardized coefficients are employed to transform all variables to a common scale, enabling meaningful comparison of their relative effects. According to the standardized regression equation (
2), four factors: WF, FO, WP, and FS positively influence consumers’ online purchase intention (OPI) during Flash Sales programs. In contrast, Perceived Risk (PR) exerts a negative effect on OPI in this context.
5. Research Results
5.1. Hypothetical Conclusion and Discussion
H1: Well-designed e-commerce platform functionalities positively influence consumers’ online purchase intention (Accept)
H2: Efficient transactional processes on e-commerce platforms positively influence consumers’ online purchase intention (Accept)
H3: Flash sales campaigns on e-commerce platforms positively influence consumers’ online purchase intention (Accept)
H4: FOMO negatively influences consumers’ online purchase intention (Reject)
H5: Perceived risk in flash sales on e-commerce platforms negatively influences consumers’ online purchase intention (Accept).
The analysis results indicate that all five factors exert an influence on users’ quick online purchase intention during flash sales on e-commerce platforms. Accordingly, all proposed hypotheses are accepted. The regression coefficients demonstrate the extent to which each independent variable affects the dependent variable. Specifically, the factors FS, WP, WF and FO positively contribute to users’ intention to make quick online purchases during flash sale events. In contrast, Perceived Risk (PR) has a negative impact on online purchase intention (OPI). It is noteworthy that the FS factor exhibits a substantially higher coefficient compared to the remaining four variables, whose effects are relatively minor. This suggests that the implementation of flash sales programs by e-commerce platforms plays a dominant role in driving users’ quick online purchase intentions.
The present study confirms that multiple factors significantly influence users’ quick online purchase intention during flash sales on e-commerce platforms. These results are consistent with prior empirical findings in the literature.
To begin with, WF positively influence online purchase intention, supporting the findings of
| [15] | Jasur Hasanov & Haliyana Khalid. (2015). The Impact of Website Quality on Online Purchase Intention of Organic Food in Malaysia: A WebQual Model Approach. Procedia Computer Science, 382-389. |
[15]
, who demonstrated that high-quality website attributes—such as ease of navigation, visual appeal, and informative content—enhance consumer trust and lead to greater purchase intention in online settings. In addition, the factor WP was shown to positively affect consumers' quick online purchase intention. This finding is in line with
| [27] | Pavlou, P. A. (2003). Consumer Acceptance of Electronic Commerce: Integrating Trust and Risk with the Technology Acceptance Model. International Journal of Electronic Commerce, Vol. 7, No. 3 (Spring, 2003), 101-134. |
[27]
, who emphasized that transaction efficiency and process reliability play critical roles in reducing uncertainty and facilitating consumer acceptance in e-commerce environments.
Moreover, FO emerged as a significant driver of purchase intention. This finding is consistent with prior research suggesting that FOMO creates a sense of urgency and stimulates impulsive behavior, especially during limited-time promotional events, which increases the likelihood of immediate purchase decisions
| [1] | Adis Rizki Pratama, Mohammad Rosid Alfiyan, Misbak, Tiara Muthiarsih. (2025). The Effect Of Flash Sale, Onlıne Fear Of Mıssıng Out (On-Fomo) And Hedonısm Shoppıng Motıvatıon On Onlıne Impulse Buyıng Behavıor In Kahf Products. Asian Journal of Management, Entrepreneurship and Social Science 5(3), 438-452. |
[1]
. It is noteworthy that although Hypothesis H4 was rejected, the FO factor still demonstrated a positive effect on purchase intention, albeit with a relatively small impact coefficient. This finding contrasts with the results of previous studies by
| [19] | Laura Frances Bright & Kelty Logan. (2018). Is my fear of missing out (FOMO) causing fatigue? Advertising, social media fatigue, and the implications for consumers and brands. Internet Research 28(5), 1213-1227. |
| [42] | Zhou, T., Lu, Y., & Wang, B. (2010). Integrating TTF and UTAUT to explain mobile banking user adoption,. Computers in Human Behavior, 26, 760-767. |
[19, 42]
, which reported a more substantial influence of FO on consumer purchase intention.
The FS factor was found to exert the most substantial positive effect on online purchase intention. This result is congruent with
| [20] | Lifang Peng, Weiguo Zhang, Xiaorong Wang & Shuyi Liang. (2019). Moderating effects of time pressure on the relationship between perceived value and purchase intention in social E-commerce sales promotion: Considering the impact of product involvement. Information & Management 56(2), 317-328. |
[20]
, who found that flash sales leverage time pressure and perceived exclusivity to motivate consumers toward immediate purchasing actions.
Conversely, the factor PR was negatively associated with purchase intention. This aligns with the study by
| [5] | Dan J. Kim, Donald L. Ferrin & H. Raghav Rao. (2008). A trust-based consumer decision-making model in electronic commerce: The role of trust, perceived risk, and their antecedents. Decision support sysstems 44(2), 544-564. |
[5]
, which revealed that concerns regarding product quality, transaction security, and privacy significantly reduce consumers’ willingness to engage in online purchases.
This study presents findings that diverge from those of several previous investigations regarding factors influencing online purchase intention during flash sales. Notably, while
| [22] | Mingming Zhang & Guicheng Shi. (2022). Consumers’ Impulsive Buying Behavior in Online Shopping Based on the Influence of Social Presence. Computational Intelligence and Neuroscience,, 1-8. |
[22]
identified FO as the most influential factor driving online purchase behavior—emphasizing its role in creating urgency and promoting impulsive buying—our results indicate that FS exert the strongest effect. This suggests that the structural design of sales events (e.g., time-limited offers, scarcity strategies) may be more impactful than psychological motivations alone in shaping consumer behavior.
Additionally, the study challenges earlier findings regarding the role of PR. For instance,
| [5] | Dan J. Kim, Donald L. Ferrin & H. Raghav Rao. (2008). A trust-based consumer decision-making model in electronic commerce: The role of trust, perceived risk, and their antecedents. Decision support sysstems 44(2), 544-564. |
[5]
found that PR had an insignificant or moderated effect in high-trust e-commerce environments. In contrast, our results reveal that PR has a statistically significant negative impact on users’ quick online purchase intention. This indicates that concerns about transaction security, product authenticity, and delivery reliability remain salient even in promotional contexts like flash sales.
These discrepancies suggest that the relative influence of psychological and system-related factors may vary depending on market conditions, platform credibility, and user experience, underscoring the need for a contextualized approach to online consumer behavior research.
5.2. Implications
This study offers several key implications for e-commerce platform managers and digital marketing strategists. Among the five factors identified as influencing quick online purchase intention, the implementation of flash sales programs emerged as the most influential. This underscores the critical importance of structuring time-sensitive sales events—such as limited-time discounts, countdown timers, and low-stock notifications—to effectively stimulate consumers’ urgency and encourage immediate purchasing behavior. Enhancing the design, clarity, and frequency of such campaigns may significantly improve conversion rates during promotional periods.
Other variables, including WF, WP, and FO also demonstrated positive effects on purchase intention, though to a lesser extent. In the context of well-established and reputable e-commerce platforms, these factors appear to play a more supportive role. When consumer trust in the platform is already high, elements such as interface design and emotional triggers like FO may have a relatively diminished impact on purchasing decisions.
However, the study also reveals that PR maintains a statistically significant negative influence on quick online purchase intention. Despite the attractiveness of flash sales, concerns related to product quality, transaction security, and delivery reliability remain salient. This finding highlights the necessity for platforms to implement robust risk mitigation strategies, including clear return policies, verified seller programs, and secure payment mechanisms, to maintain consumer confidence in high-pressure sales environments.